
An introduction to the block boundary diagram
The AIAG & VDA FMEA Handbook, published in June 2019, explains how to set up a Design FMEA analysis using seven steps. Structure analysis, Step 2, depicts the architecture of the studied system with the two recommended tools being tree structures and boundary diagrams.
- A tree structure represents the hierarchy between the system, subsystems, and components.
- The boundary (or block) diagram goes into deeper details about the relationships between all the system elements, as well as the relationships between these system elements and the nearby elements.
System Modeling Language (SysML) models complex systems using nine diagrams. Two of these, the Block Definition Diagram (bdd) and the Internal Block Diagram (ibd), use block elements to model the architecture of a system.
- Block Definition Diagrams depict the hierarchy of a studied system by identifying the system, subsystems, and components.
- Internal Block Diagrams use this hierarchy to illustrate the interactions between the different elements.
Please note: Internal Block Diagrams are different from functional block diagrams for internal functional analyses generated by the Structure tool.
What are the expectations in the AIAG & VDA FMEA Handbook?
The AIAG & VDA FMEA Handbook states the following for Step 2:
- Visualize the analysis parameter
- Depict the composition and the hierarchy of the studied system
- Identify and illustrate the interfaces between the system elements and the nearby elements
- Build the Design FMEA
How can you meet these requirements?
The use of SysML structural diagrams helps you meet the requirements in this step.
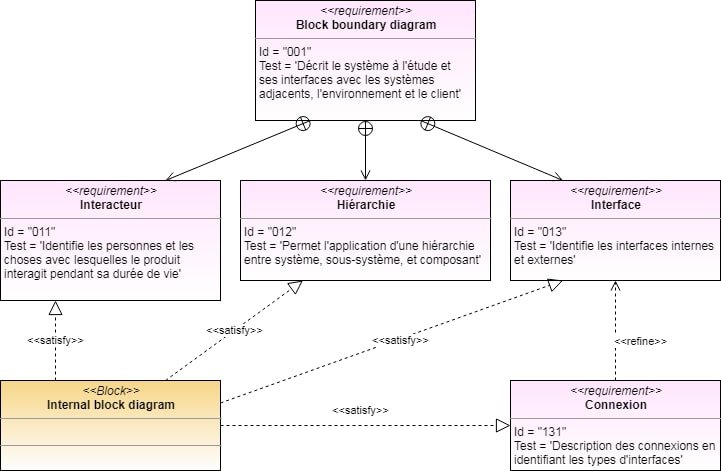
All people and things the product will interact with during its life cycle (interactors) can be identified within an Internal Block Diagram (ibd), which models the context for use of the targeted product.
To apply the hierarchy to the system, subsystems, and components, the ibd authorizes interconnection between the blocks. For instance, a diagram represents the targeted system. The blocks modelled in the diagram are the subsystems, and the interconnected blocks in the subsystems represent the components.
The interfaces and connections between the system elements and also between the system elements and the outside ones are modelled and illustrated through ports and links between the blocks. These links can be typified and illustrated as physical contact, energy transfer, information transfer, and matter exchange.
Knowllence’s Block Boundary Diagram tool
The Internal Block Diagram enhances the tools available in Robust Engineering Suite by Knowllence: APTE diagrams, Environment Interaction Diagrams, FAST diagrams, functional block diagrams, SADT diagrams, and functional analysis charts.
This diagram rounds out the functional and structural analysis and makes it easier to model complex systems by taking into consideration mechanical, electronic, mechatronics, and software issues.