The P-Diagram is a graphic tool created before a project in addition to the product’s functional analysis.
The P-Diagram appears in the AIAG 4th Edition manual. In 2020, the AIAG & VDA FMEA Handbook also presented this tool and proposed a variant to supplement the functional analysis process. This article focuses on the original approach when designing a product.
Why is the P-Diagram important?
A parameter diagram challenges the preconceived notion that an ideal function fully converts input data to output data.
In the real world, nothing works this way. No system is 100% efficient. Other physical phenomena enter into the scene and can affect the carrying out of the function, which results in parasitic phenomena that the design also needs to consider.
The P-Diagram combines the functional analysis and the dysfunctional analysis, which are usually performed sequentially.
It is completely adapted for the preparation of Design FMEAs and can be the substitute for a Preliminary Risk Analysis in any mechanical, mechatronic, or electronic sector.
How do we use the P-Diagram?
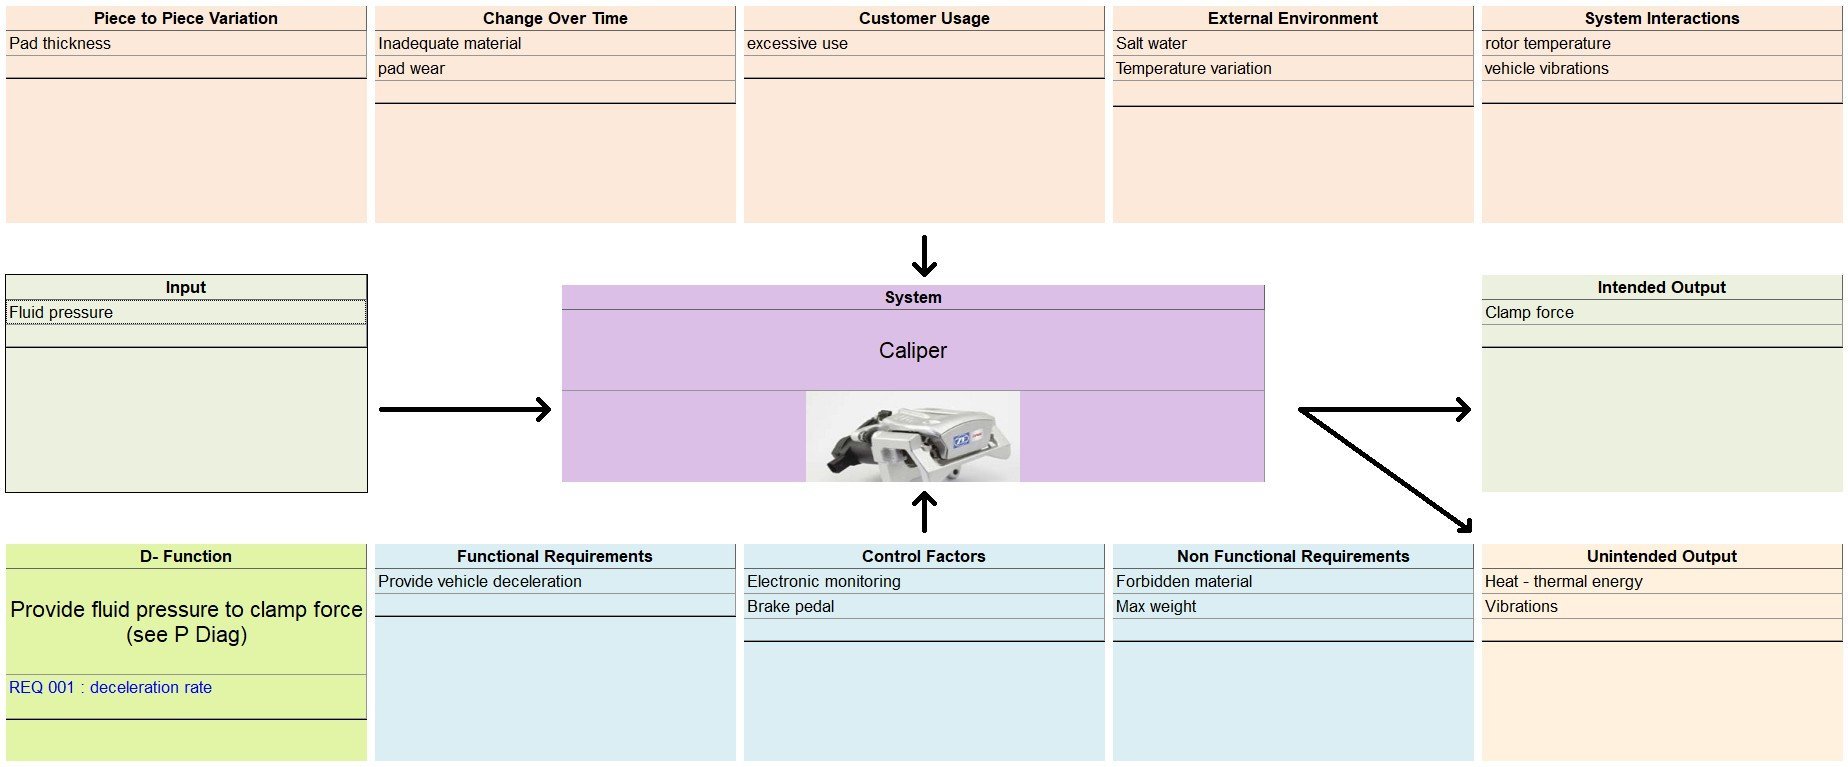
The first step consists of characterizing the ideal behaviour of the operating system:
- The level of expected requirements (performance, criteria, levels)
- The inputs (which detail the required sources)
- The intentional outputs (those expected directly)
The investigation then continues as an analysis of unintended outputs, meaning the physical phenomena that are not desired but which we must take into account. An example of an unintended output in a combustion or electric engine would be heating of the system or the creation of vibrations, for instance.
Lastly, the identification of noise factors that are the source of undesired variations during operation. These noise factors can be categorized as:
- Part-by-part variation
- Change over time
- Customer use
- External environment
- Interaction between systems
The control factors are the dynamic parameters, which can be acted on to make the system less sensitive to noise. Users can act on them directly or through a related system to adapt the system response proportionally.
Here is an example of a complete P-Diagram carried out on a brake calliper. The diagram was structured using our FMEA tool in Robust Engineering Suite.